1 The use-case data
TipLearning Objectives
- Understand the aim and design of a common expression proteomics experiment
- Know how relative quantitation can be achieved using Tandem Mass Tag (TMT) labelling
- Know what a database/identification search is and what data level to output and begin processing your data
1.1 Exploring changes in protein abundance across stages of the cell cycle
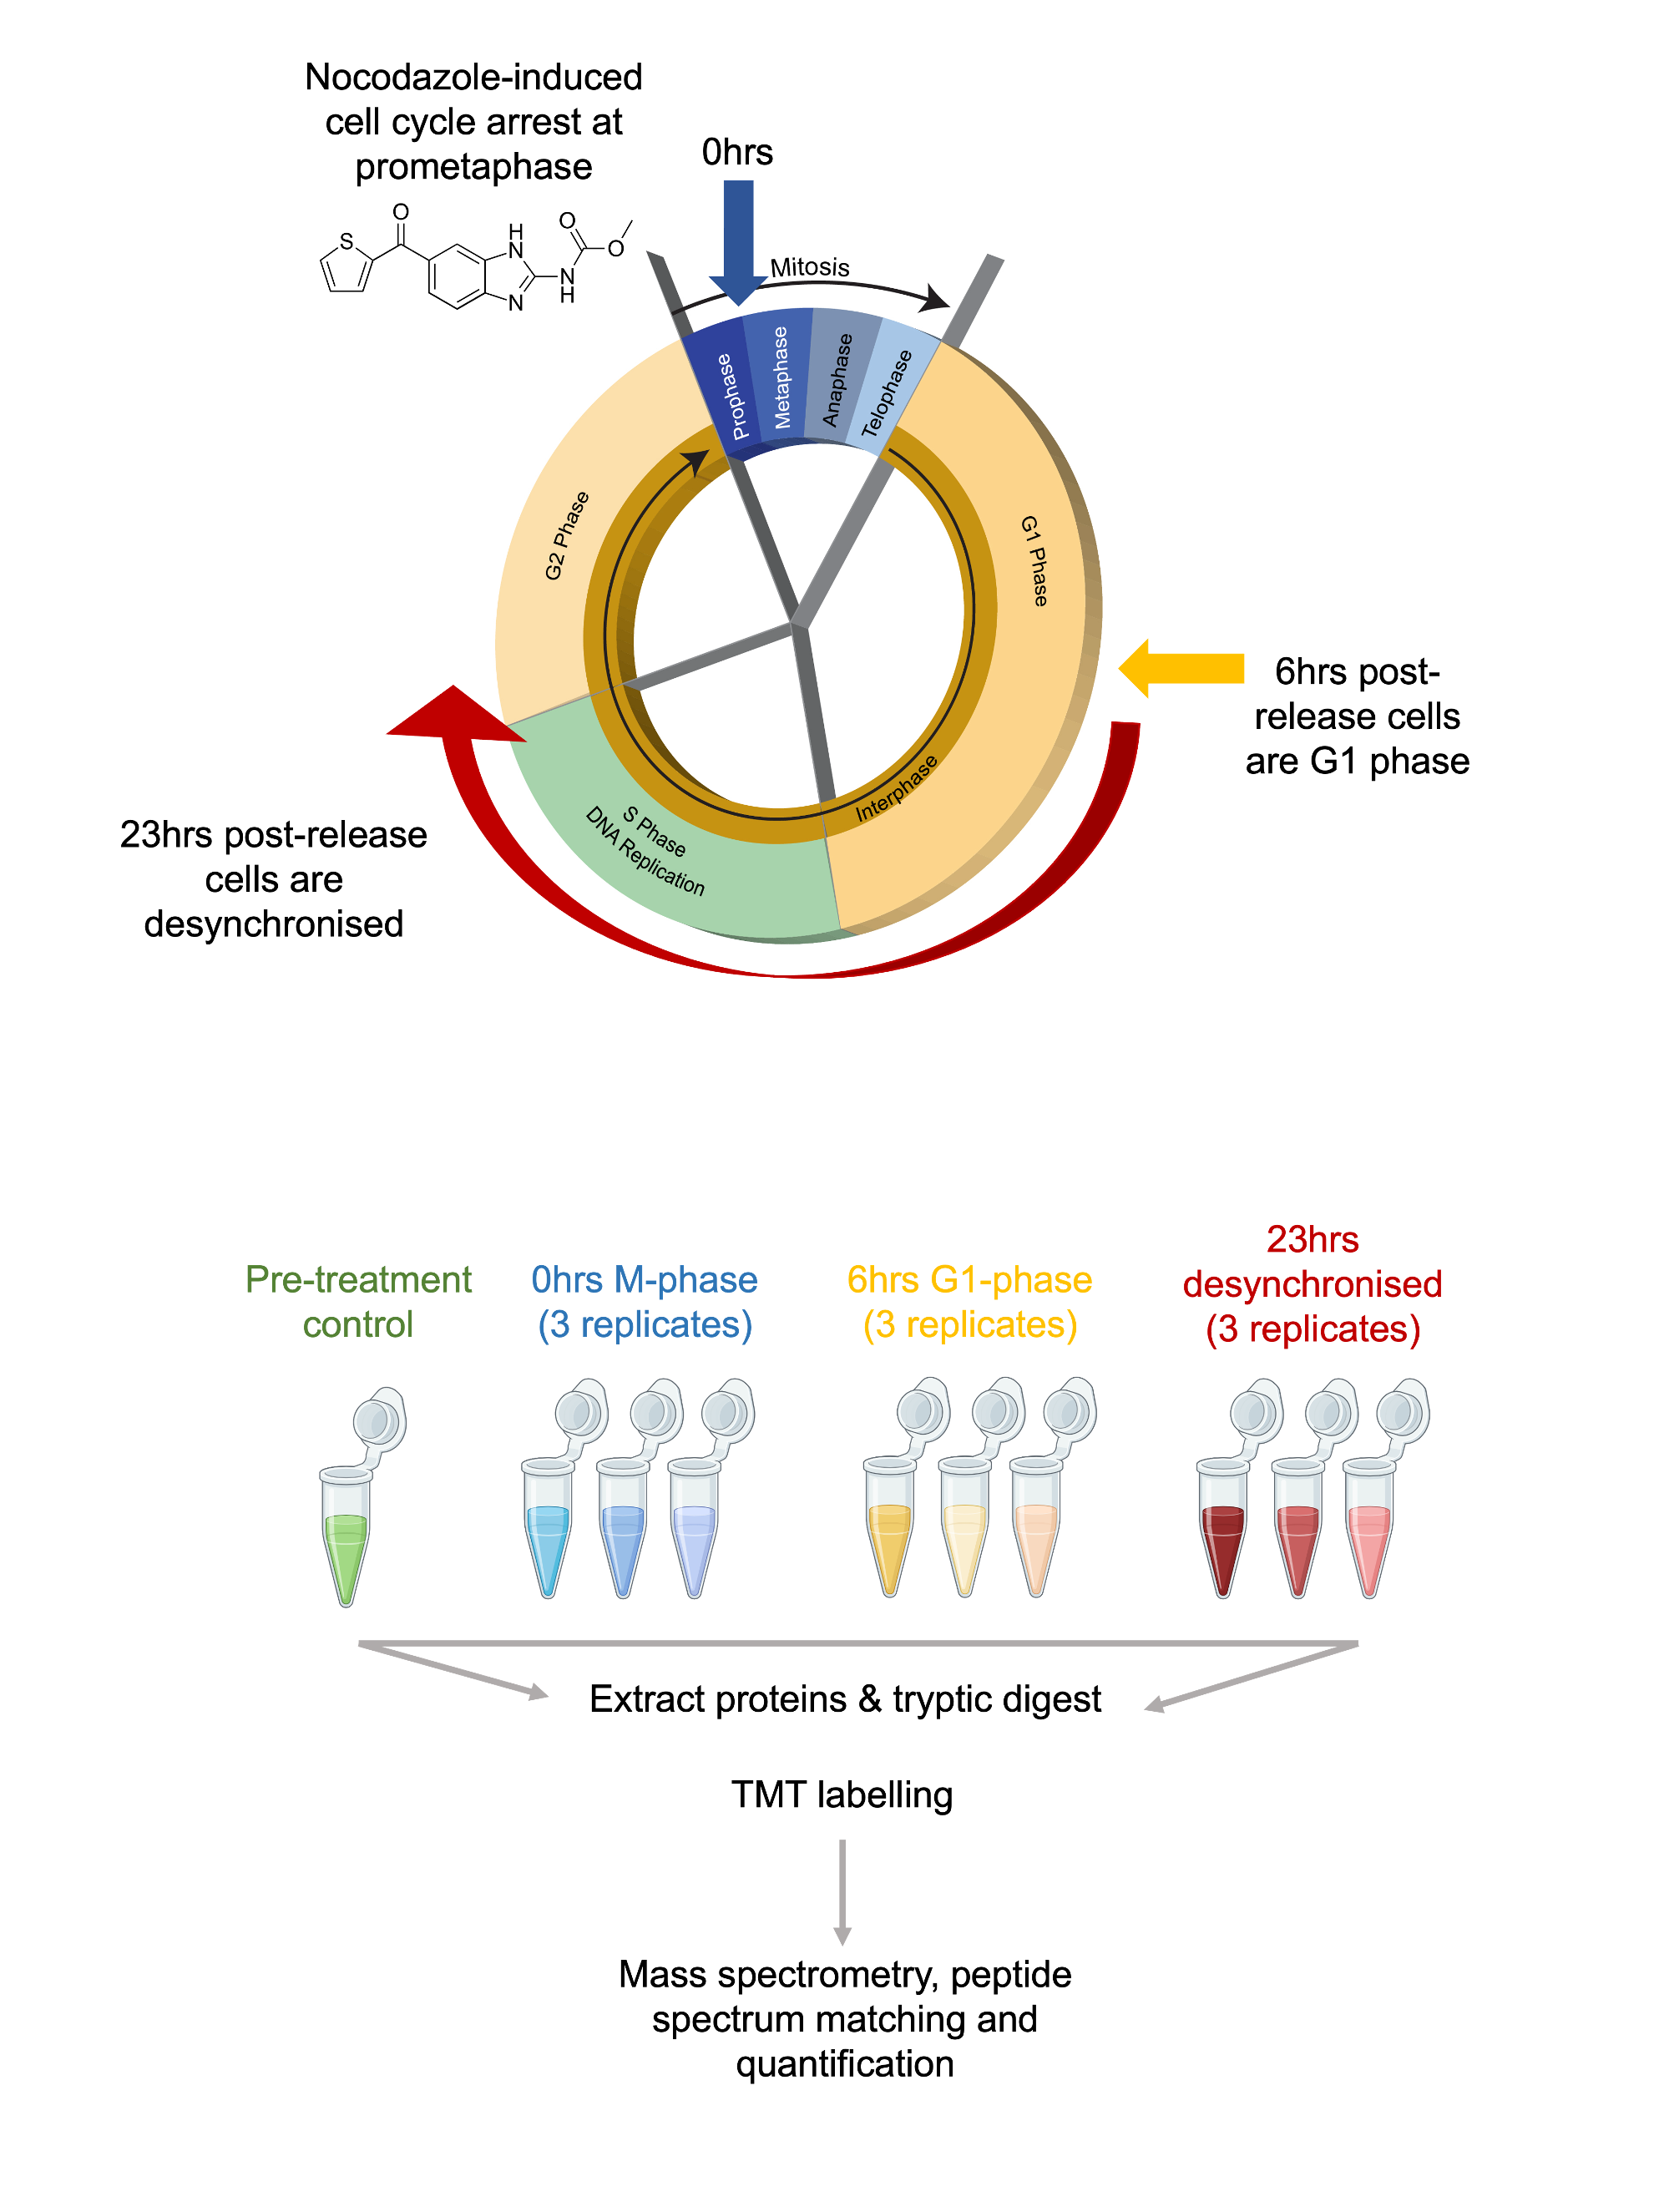
As a use case, we will analyse an expression proteomics dataset from Queiroz et al. (2019). The aim of this experiment was to examine proteins involved in the cell cycle (see Figure 1.1). Briefly, cells from a human cell line (U-2 0S) were treated with Nocodazole to inhibit the polymerisation of microtubules and block the transition beyond the prometaphase stage of M-phase. After 18-hours of treatment, the cells were released from cell cycle inhibition by withdrawing Nocodazole. Samples were taken in triplicate at 0, 6 and 23-hours post-withdrawl to generate 3 x M-phase samples, 3 x G1-phase samples and 3 x desynchronised samples. A sample of cells was also taken prior to Nocodazole treatment as an additional control, thus giving a total of 10 samples.
To measure protein abundance via bottom-up mass spectrometry, protein samples were digested to peptides using trypsin (an enzyme which cleaves proteins at the C-terminus of arginine and lysine residues, except where there is an adjacent proline residue). The same quantity of peptide from each sample was then labelled using Tandem Mass Tag (TMT) labels. This allows all of the samples to be combined into a single pooled MS sample, thus reducing technical variability and MS time, as well as ensuring quantification of the same peptides in each samples. The TMT labelling strategy is outlined below in Table 1.1.
| Sample Name | Timepoint | Replicate | Tag |
|---|---|---|---|
| Control | Pre-treatment | NA | 126 |
| M_1 | 0hrs | 1 | 127N |
| M_2 | 0hrs | 2 | 127C |
| M_3 | 0hrs | 3 | 128N |
| G1_1 | 6hrs | 1 | 128C |
| G1_2 | 6hrs | 2 | 129N |
| G1_3 | 6hrs | 3 | 129C |
| DS_1 | 23hrs | 1 | 130N |
| DS_2 | 23hrs | 2 | 130C |
| DS_3 | 23hrs | 3 | 131 |
1.2 Isobaric peptide labelling using Tandem Mass Tags (TMT)
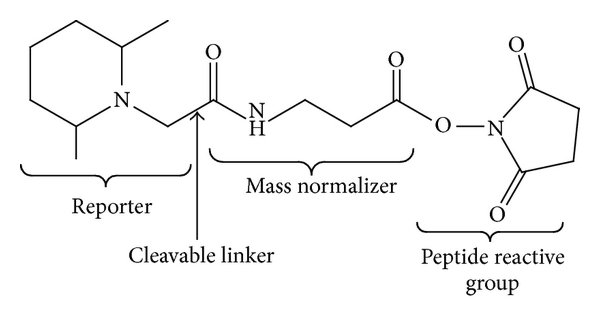
As outlined above, the use-case experiment made use of tandem mass tag (TMT) labelling. TMT reagents are isobaric chemical labels that can be covalently linked to peptide amine groups, either at the peptide N-terminus or at lysine (K) residues. These reagents are currently available in kits (referred to as TMTplexes) containing 6 (TMT6plexTM), 10 (TMT10plexTM), 16 (TMTpro 16plexTM), 18 (TMTpro 18plexTM) or 32 (TMTpro 32plexTM) TMT labels. Further, kits can be combined to multiplex up to 35 samples. The isobaric nature of TMT reagents means that all of the labels within a TMTplex have the same overall mass. However, they differ in how this mass is distributed between their two variable regions - the reporter and mass normaliser. The structure of a TMT label is shown below in Figure 1.2.
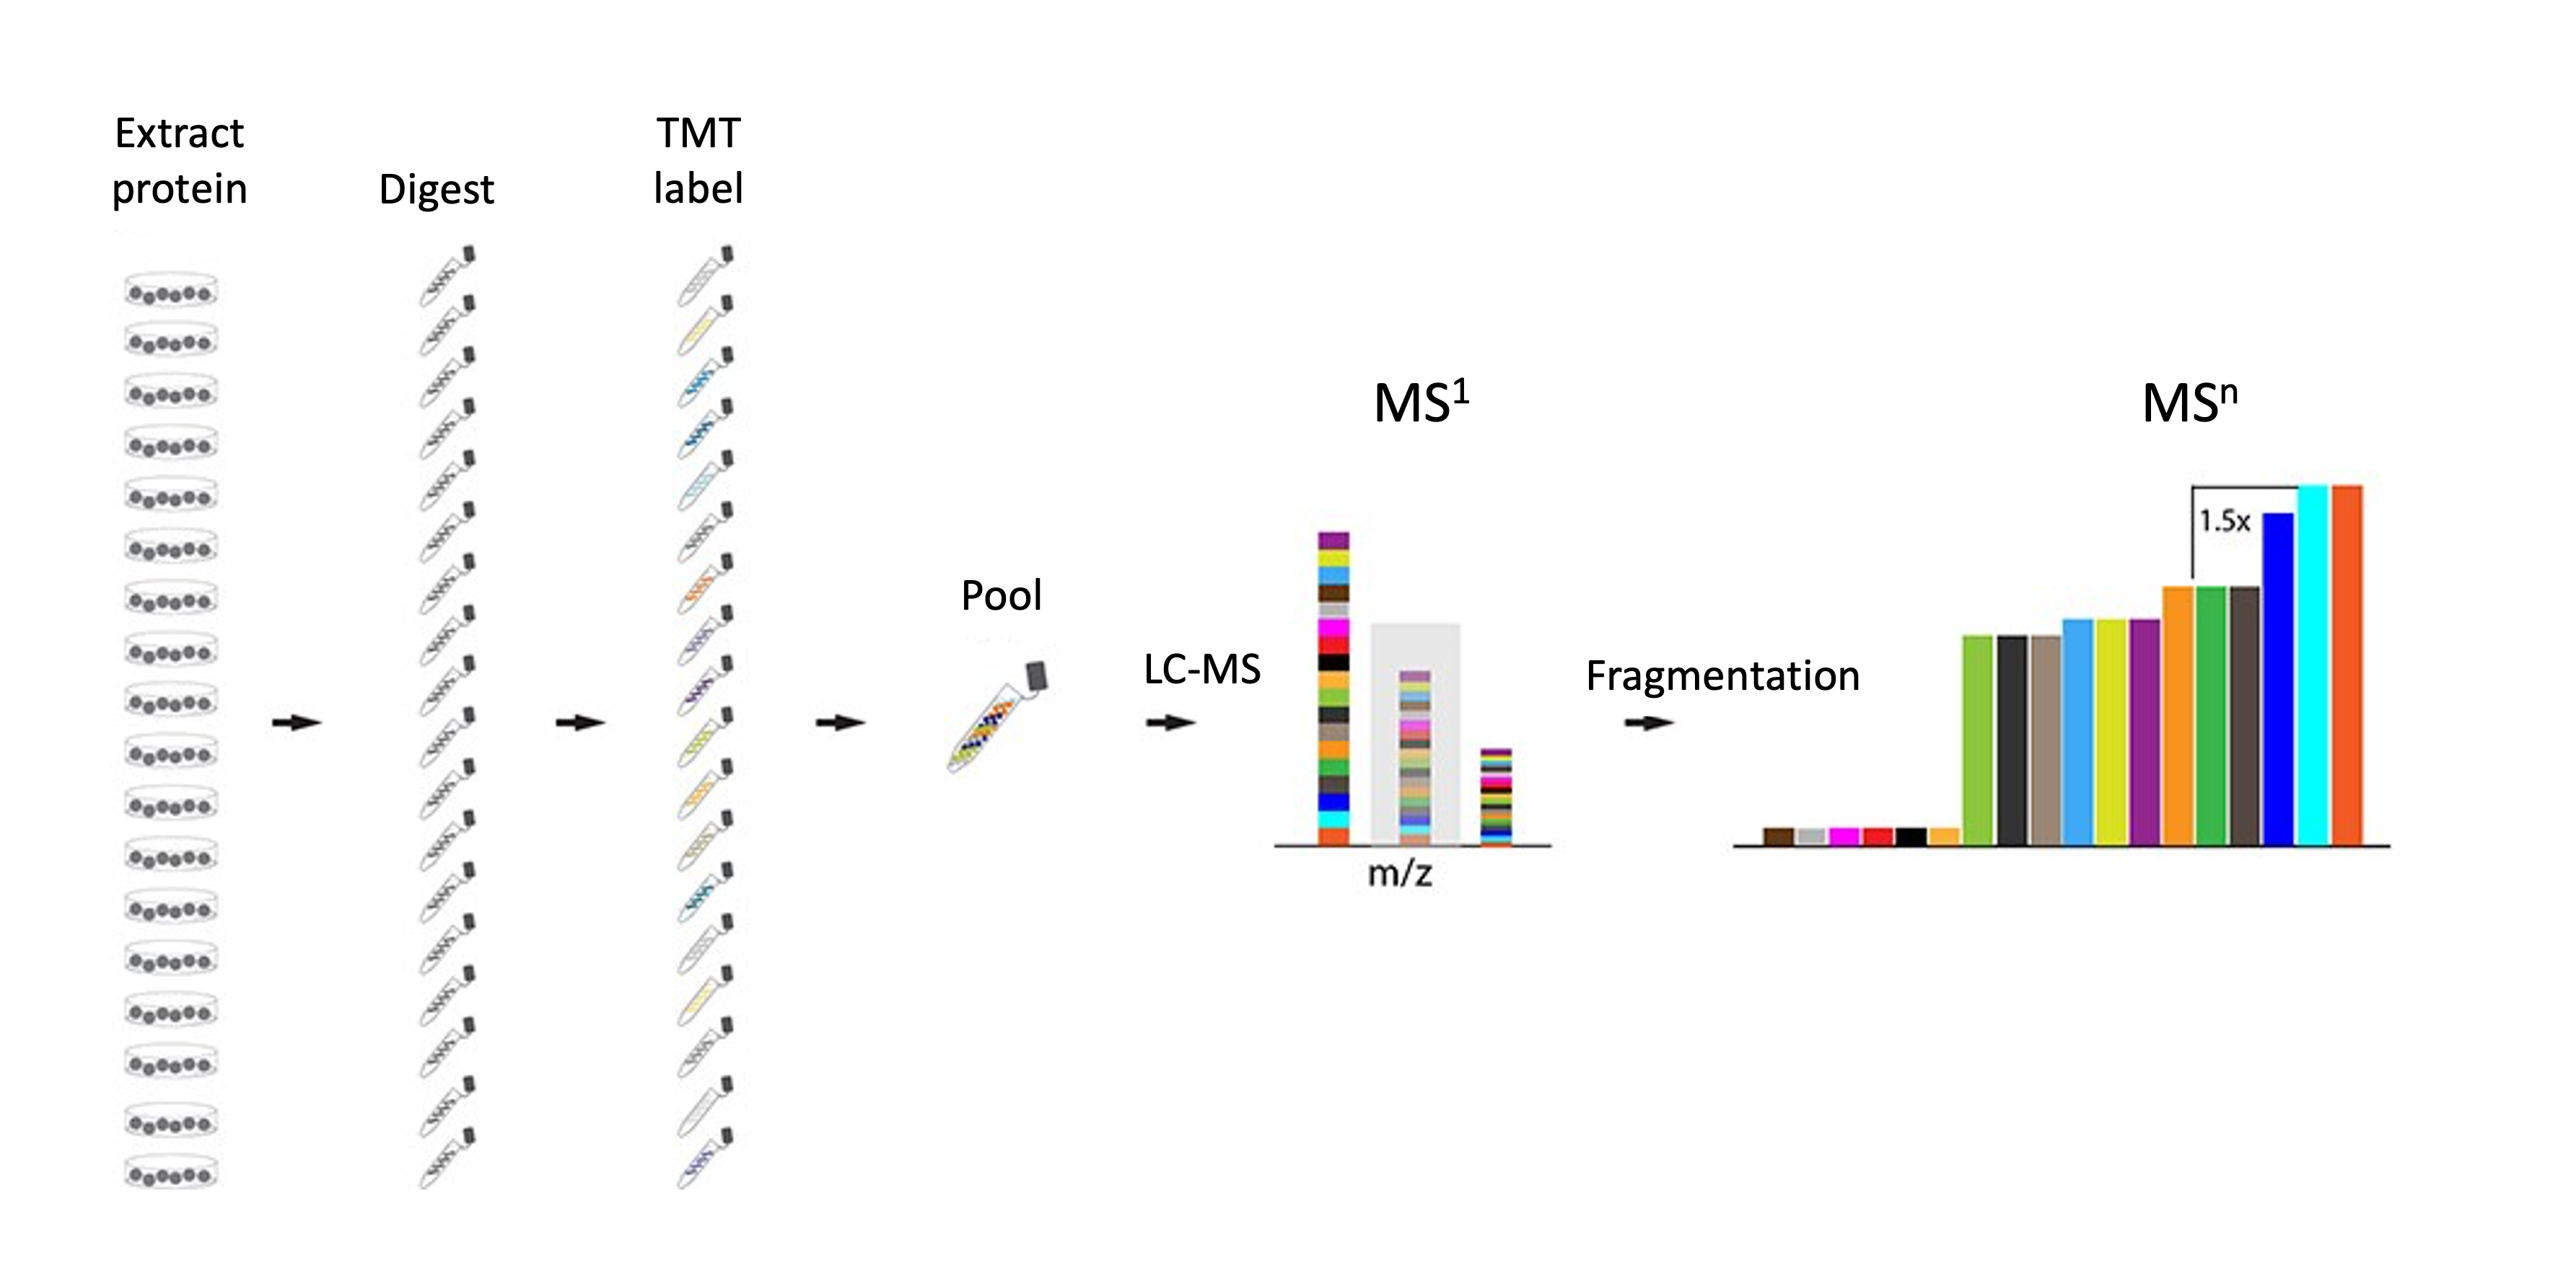
After labelling each sample with a different TMT reagent, the same peptide will have an identical mass but be differentially labelled across samples. The samples are then pooled together and run on the MS as a single multiplexed sample. In the MS1 spectra it is not possible to distinguish how much of each peptide (peak) was derived from each sample because all of the labelled peptides still have the same overall mass. During fragmentation, however, a cleavable linker within the TMT label is broken, thereby releasing a section of the label called the reporter ion. The mass of this reporter ion is different between TMT labels due to differences in the distribution of isotopes (C13 and N15) between the mass reporter and mass normalizer regions. As a result, the spectra of fragment ions will contain one peak per reporter ion and the relative intensity of these ions can be used to calculate the relative abundance of the identified peptide across the labelled samples. This is summarised below in Figure 1.3.
This means that TMT labelling can be used for the relative quantification of peptides (and in turn proteins) across samples. Here we will use the relative reporter ion intensity of our TMT labels to compare abundance between samples taken throughout the cell cycle. If we wanted to carry out absolute quantification of proteins, TMT labelling would not be an appropriate method.
NoteMS2- vs. MS3-based TMT quantitaion
Originally the reporter ion of a TMT reagent was released by fragmentation of the precursor peptide. This meant that the reporter ion signals could be calculated based on MS2 spectra, and hence TMT quantitation was done at the MS2 level. However, different precursor peptides can have very similar m/z values, resulting in their MS1 peaks being very close together. When one of these precursors is selected for fragmentation it is possible for other precursors to be unintentionally co-isolated within the same fragmentation window. This results in co-isolation interference since the reporter ions present at MS2 are not only from the identified peptide but also any other co-isolated peptides.
More recently, MS3-based quantitation has been applied to reduce the problem of co-isolation interference and increase quantitation accuracy when using TMT labels Ting et al. (2011). In this approach the initial round of precursor fragmentation only uses a weak fragmentation method (e.g., collision induced dissociation, CID) to ensure that TMT reporter ions are not broken off at MS2. The most abundance fragment ions from MS2 are then selected for a second round of fragmentation, this time using a stronger force (e.g., high-energy collision dissociation) so that the TMT reporter ions are released. Since the MS2 fragment ions derived from the intended precursor peptide are more abundant than the unwanted MS2 fragments from co-isolated peptides, the MS3 fragments and reporter ions provide a much cleaner quantitation of the identified precursor peptide. The MS3 reporter ion quantitation is almost purely from the peptide that we want, not from a mixture of all co-isolated peptides.
The specific MS3 data acquisition approach used to generate our data was synchronous precursor selection (SPS)-MS3. In simple terms, the SPS method allows us to select multiple MS2 fragments for additional fragmentation to the MS3 level, rather than just one McAlister et al. (2014).
1.3 Identification search of the raw MS data
Having analysed the pooled TMT sample via MS, the raw MS were processed using Proteome Discoverer v3.0 (Thermo Fisher Scientific). This software is one of several that can be used to carry out a database search to identify and quantify peptide sequences, and therefore proteins, from raw MS data. Others include MaxQuant, FragPipe and PEAKS among others.
Briefly, database searching of MS data involves comparing the observed MS spectra to expected MS spectra generated via in silico digestion of a selected protein database. Since the use-case data used human cells, we provided the human proteome to Proteome Discoverer as the database for searching. We also provided a database of common contaminants that could be present in our sample due to (i) human contamination (e.g., keratin from nails, hair or skin), or (ii) sample preparation (e.g., enzymes used for protein digestion). These two databases are can be found in the course materials and also at https://zenodo.org/records/7837375. The result of such a database search is a list of peptide spectrum matches (PSMs), that is a list of matches between observed and expected spectra. Most software will also aggregate the PSM level data upward and provide output files at all data levels (PSM, peptide and protein). It is up to the user which output file to use for further analysis.
The starting point for this workshop and data processing workflow in R is an output file from the identification search. Proteome Discoverer provides each data level output as a separate .txt file. Here, we will use the PSM-level .txt file.
1.4 Starting analysis from PSM, peptide or protein level
In general, to allow for maximum control of data quality, normalisation and aggregation it is advisable to begin analysis from the lowest possible data level. This will ensure a greater understanding of the data and facilitate transparency throughout the process.
For TMT data we can start our data analysis from the PSM level. However, it is not always possible to start at this level. Some algorithms used to process label-free data may require the data to be analysed from the peptide-level. See Adapting this workflow to label-free proteomics for more details.
1.5 Summary
The use-case data that we will process and analyse in this workshop is a DDA TMT-labelled bottom-up proteomics dataset. The aim of the experiment is to calculate relative protein abundances between samples. This will then allow us to apply statistical tests to determine whether any proteins have significantly different abundances relative to each other.
Although many of the processing and analysis steps discussed in this course are also applicable to other types of proteomics datasets (particularly label-free DDA bottom-up proteomics), there is no one-size-fits-all workflow for expression proteomics. Some aspects of the workflow would need to be adapted for other types of proteomics experiment. We have provided details on how this workflow could be adapted to label-free data or data processed using MaxQuant rather than Proteome Discoverer.
1.6 Glossary
Key terms that you should understand for this workshop:
Precursor ion = the original parent ion representing an ionized form of the entire peptide sequence.
Fragment ion = an ion produced by fragmentation of the precursor ion, thus only representing a fraction of the original peptide sequence.
MS1 spectrum = raw mass spectrum produced by the separation of precursor ions based on their mass-to-charge ratio (m/z). Each peak represents a precursor ion at a particular m/z and with an associated intensity.
MS2 (MS/MS) spectrum = raw mass spectrum produced by the separation of fragment ions based on their mass-to-charge ratio (m/z). Each peak corresponds to a fragment ion derived from the same precursor ion.
Peptide spectrum match (PSM) = A match made between a theoretical mass spectrum for a given peptide sequence and an observed experimental spectrum, thus linking a raw mass spectrum to its predicted peptide sequence
Tandem mass tag (TMT) = a type of peptide label which can be used for relative quantification of peptides across samples. Quantification is measured at the MS2 or MS3 level.
References
McAlister, Graeme C., David P. Nusinow, Mark P. Jedrychowski, et al. 2014. “MultiNotch MS3 Enables Accurate, Sensitive, and Multiplexed Detection of Differential Expression Across Cancer Cell Line Proteomes.” Analytical Chemistry 86 (14): 7150–58. https://doi.org/10.1021/ac502040v.
Queiroz, Rayner M. L., Tom Smith, Eneko Villanueva, et al. 2019. “Comprehensive Identification of RNAprotein Interactions in Any Organism Using Orthogonal Organic Phase Separation (OOPS).” Nature Biotechnology 37 (2): 169–78. https://doi.org/10.1038/s41587-018-0001-2.
Ting, Lily, Ramin Rad, Steven P Gygi, and Wilhelm Haas. 2011. “MS3 Eliminates Ratio Distortion in Isobaric Multiplexed Quantitative Proteomics.” Nature Methods 8 (11): 937–40. https://doi.org/10.1038/nmeth.1714.